Conventional thinking has it that the office market crisis has no bounds and that remote and hybrid work have disrupted tenants’ use of large and small buildings alike. Moreover, the prevailing view is that small cap office properties are not competitive with bigger buildings whose owners tend to make capital improvements and add amenities in order to retain or attract tenants.
These are reasonable assumptions, but they are off the mark. In fact, Boxwood’s research suggests the opposite: i.e., small cap office buildings have outperformed larger buildings and have largely escaped the broader office market upheaval to date. Our analysis of Q1 CoStar occupancy data involving small office buildings under 50,000 sq. ft. reveals the following comparisons and highlights:
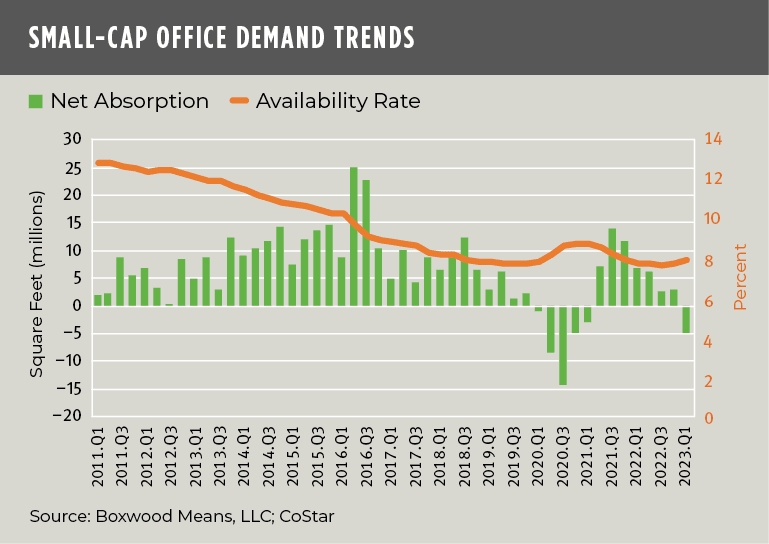
- Demand bent but didn’t break. The small cap office market represents roughly half of the total RBA of the national office sector’s 8.4 billion sq. ft. While occupancy losses among smaller-sized buildings amounted to nearly 5 million sq. ft in Q11, this total was only a quarter of the total negative net absorption for the sector in the aggregate.
- Growth in available space was moderate. The office availability rate, which combines sublease space, other marketable tenant space and physically vacant offices, rose 20 bps YOY to 8.5% among small buildings. At this level, office availability is still lower than the 9.4% pandemic peak and the 10.5% average over the long term (see the nearby graph). Tangentially, Barclays Research reported that the Building Class C national office availability rate was less than one half of Class B office and nearly 4X less than the availability rate of Class A product.2
- Sublease space inched up. A million sq. ft. of sublease space was added in the quarter, raising the small cap sublet availability rate by 10 bps YOY to 0.5% of total inventory, or 20.5 million sq. ft. This sum represents only about 10% of the whopping 213 million sq. ft. of sublease space available for the nation as a whole.3
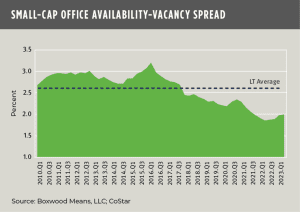
- No near-term threat to office stability. An office apocalypse for small caps isn’t in the cards – at least by one forward-looking measure. The relationship over time between the availability rate and the total vacancy rate is a window onto evolving occupier fundamentals. Generally speaking, an office market is performing well when the spread between the two is narrowing, i.e., demand is outpacing supply. Conversely, if the gap between the availability rate and the total vacancy rate is wide or growing, it indicates that office leasing conditions are relatively soft with sublet space lingering on the market and periods of negative net absorption. As shown in the nearby graph, to date the small cap office market has weathered the storm shaped by remote work – the 200-bps spread between small cap office availability and vacancy is near its recent low point over the last 13 years and well below the long-term average.
As implausible as these results may seem, the pattern and dynamics of small office building rentals offer some hints to the relatively durability of this office market segment. These reasons include:
- Tenants in these buildings are small companies that tend to occupy modest amounts of space. Their conservative office footprint typically excludes expensive common, surplus and/or amenity-laded space4 that some larger corporate tenants have built out in recent years.
- Lease terms commonly run three-to-five years max – and sometimes for shorter durations. Such modest lease commitments tend to be less risky for small firms, especially when a whiff of recession is in the air.
- Rents are also relatively cheap – again, an inducement for small firms to stay put.
- Small office buildings are concentrated in suburban locations, not in major metro CBDs. Commutes tend to be shorter, often close to home. Office workers can go home for lunch and/or take the dog out for a walk. What’s not to like? Maybe that’s why a recent CBRE survey indicated that small companies are more likely to have greater office attendance.
With alternative working arrangements now largely entrenched, many office landlords find their rents and cash flows under pressure from rising vacancies and mounting sublease space. As a result, more pain looms in terms of loan delinquencies and defaults. Yet, one corner of the office market is a safe haven of sorts and, while small cap office landlords won’t rejoice over their relative leasing position, they may not gripe either.

1 This was the first instance of negative net absorption since five consecutive quarters of occupancy losses ending in Q1 2021.
2 Class C office properties are often associated with smaller buildings.
3 The New York and San Francisco office markets account for roughly 20% of the national total according to CoStar.
4 In recent years many owners of institutionally oriented office buildings invested big dollars in team collaboration areas and/or recreational and health-related facilities like gyms, game rooms, spas and restaurants among other amenities.